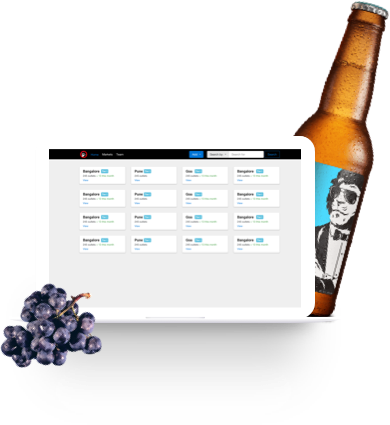
Sona beverages have come up with a beer brand called Simba in the Indian market. They were looking for a custom business intelligence application to be built for tracking their supply chain performance as a part of their country expansion plan. Our friends at beard design created the required designs for this project and engaged us to build the platform.
Sona Beverages
Business Intelligence Platform for Simba Beer
Beard Design
5 Months (Jul'18 - Nov'18)
“Data-driven decision making is key to supply chain success.” Our friends & partners at Simba beer are committed to making business decisions based on the performance analytics of various components in their supply chain.
We worked with Simba beer & beard design over 20 weeks to build a blazingly fast performance analytics platform in a way that makes the decision process easier and quicker to understand.
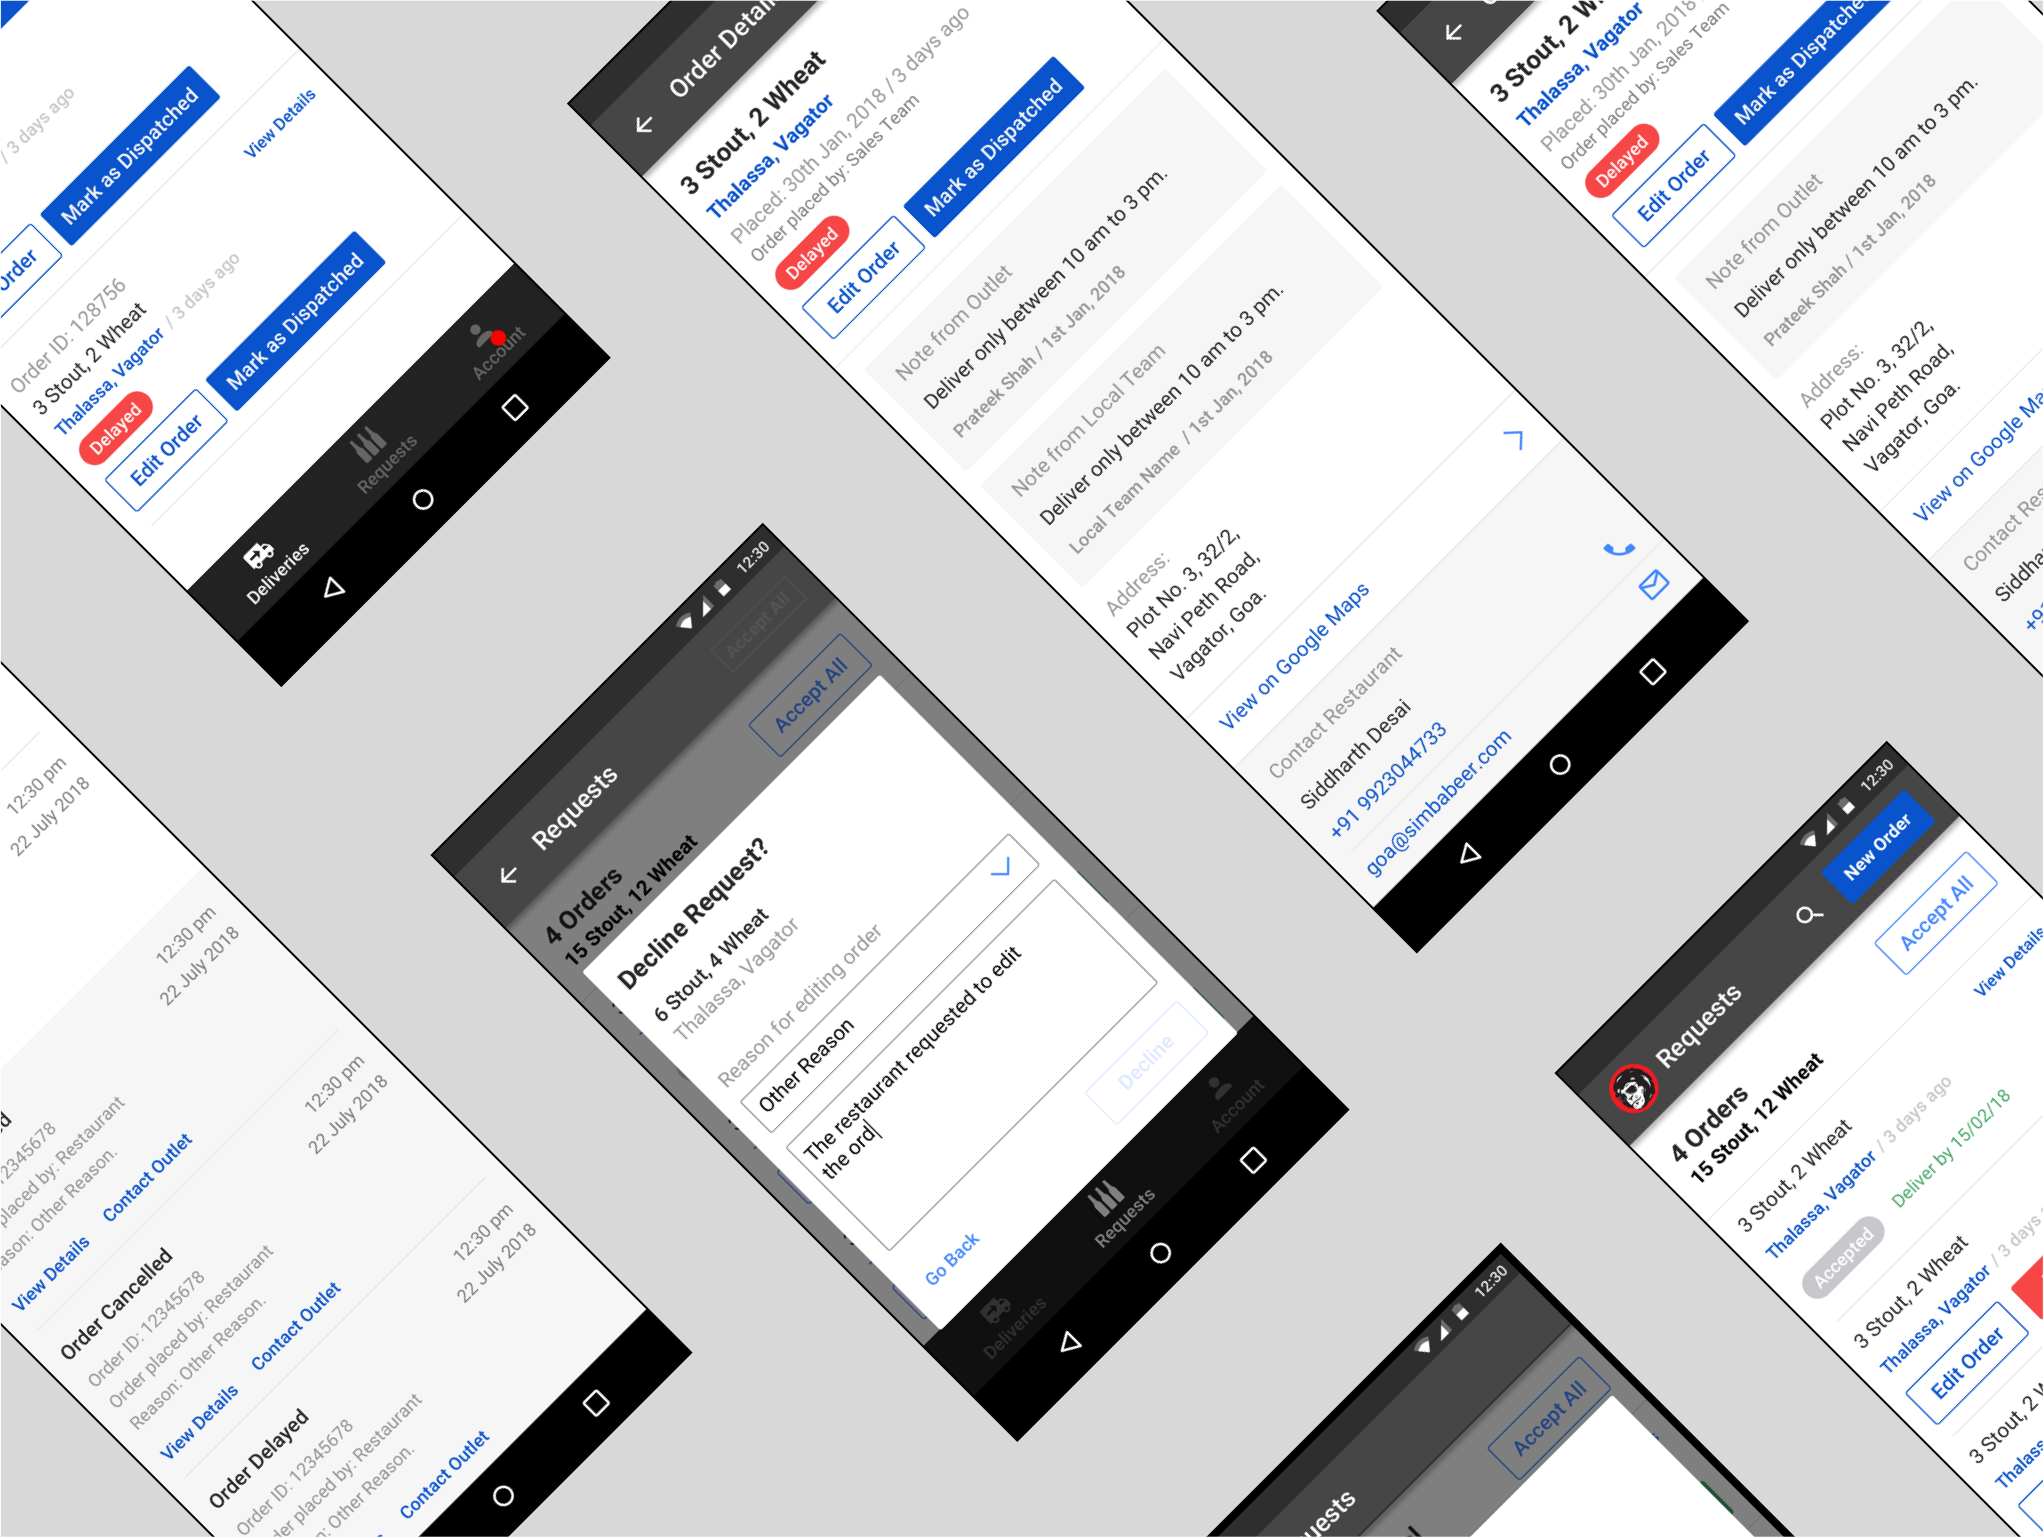
We built the entire ecosystem required to track the orders and their distribution performance. Mobile apps built for outlets allow Simba customers to place the orders for crates in an intuitive and easy manner.
Mobile apps built for the Simba beer distributors allow them to work on those order and communicate in a reliable and hassle-free way. For a supply chain business, it’s crucial to track the order from created to delivered state and time required/spent during each stage. We built a flexible system to track these data attributes with the order.
A Simba sales user global/regional can see these metrics via their dashboards. We built an alert system for sales users to keep a close watch on order volumes month by month and also on an outlet, region level. Distributor plays a key role in supply chain management; the entire company’s delivery throughput is dependent on the distributor and their readiness in handling the orders. We built intelligent distributor performance analytics metrics by analyzing the order data and tracking status changes.
Building a high performant and near real-time analytics system was a challenge and we nailed it by making use of core fundamentals of data warehousing systems. We worked backward to build the system by keeping the end analytics metrics designed and developed star-schema and flat tables to provide comparative analytics data points.
Performance of API and page load time was equally important in this project. We managed to achieve page load time less than a second with 5 years of orders data. (Results were benchmarked using J-Meter)
We designed a flexible and scalable data model in the relational database (PostgreSQL) to achieve the performance and future possible feature additions.
Graph libraries and their performance was a critical point in this project. We did close to 10 different POC’s with multiple graph libraries before settling down on Chart.js react port.
There were a lot of custom graph components which were not directly available in the library. We went the extra mile by customizing the graph library as per our need without compromising the design. That’s why we say we deliver “Pixel perfect designs”
We made use of the component architecture of react js completely keeping component reusability in mind. Instead of adding Redux.js we swiftly used context API for validation states & other things.
Our ninja frontend team also implemented the recursive nested filter in the table which was not provided by any of the libraries.
Our mobile team implemented an optimized version of the Flatlist to render heavy custom lists where memory utilization was a concern highlighted by the React Native community.
We swiftly managed the differences of rendering in the iOS and Android without degrading the quality of the designs.